
Analytics and management for an online school, without the chaos
Control and management in Softbook is end-to-end analytics, team roles and every student's progress on one base: you see learning, sales and engagement in one place, and you control what your team can reach.
- Learning, sales and engagement in one place
- Team roles and permissions
- 30 days free
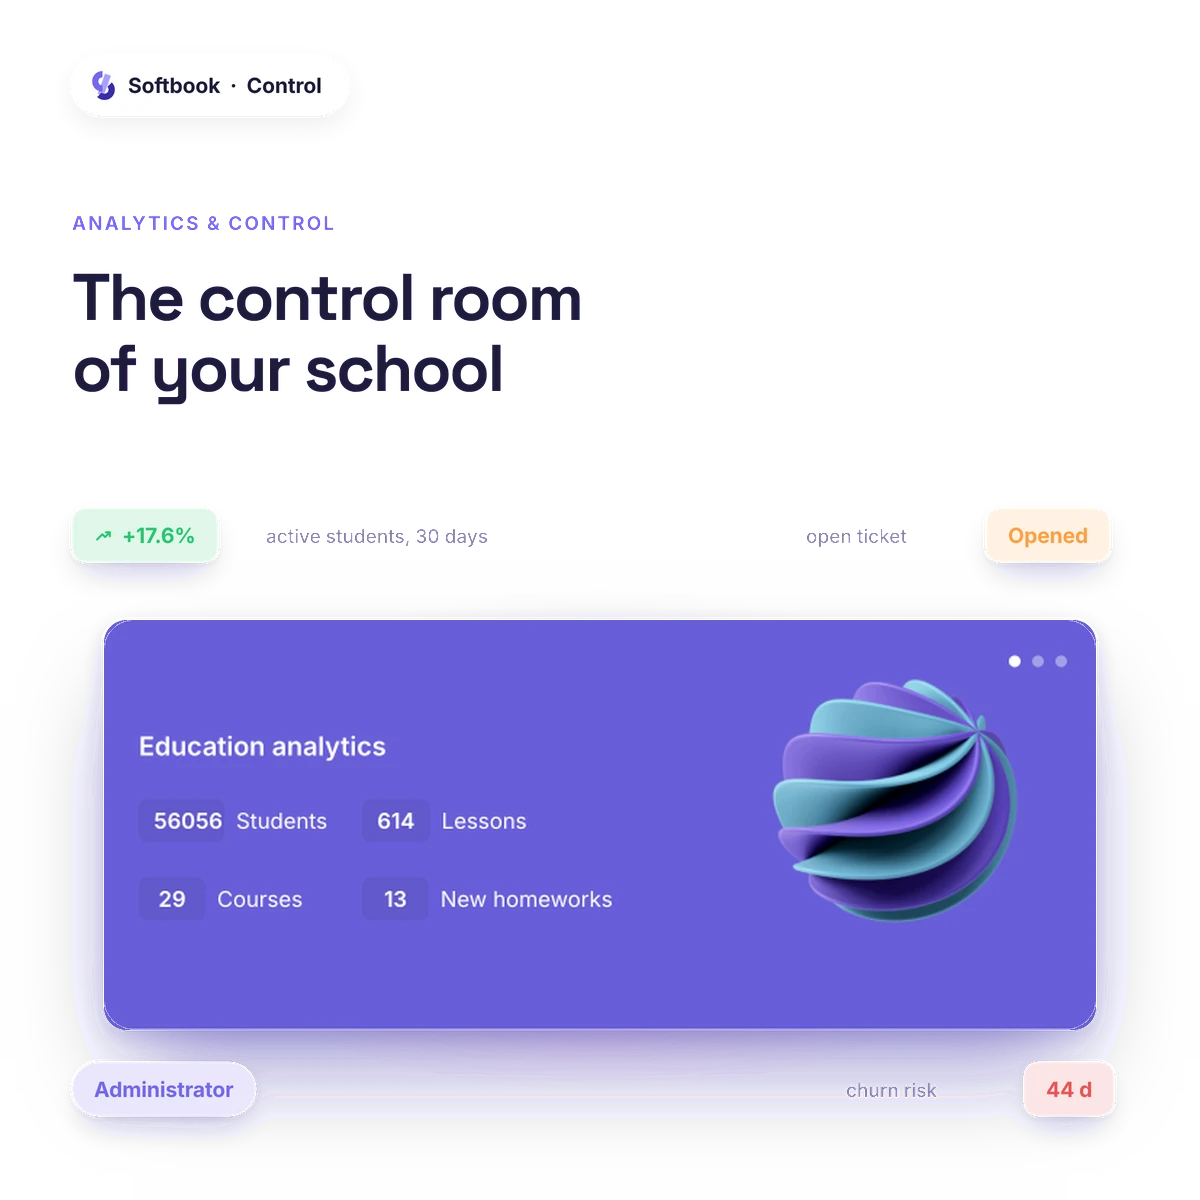
End-to-end analytics
End-to-end school analytics — in one place
You don't gather data from different services: learning, sales and engagement live on one student base. Widgets and dashboards show the picture for the period you choose.
- Learning, sales, CRM and engagement — in one place
- Widgets for the period you choose
- A separate dashboard per role or per person: the marketer sees one thing, the instructional designer another
- Comparison across periods and cohorts
- Data export for outside analysis
- Revenue, sales and learning metrics — on your phone too, in the iOS and Android app
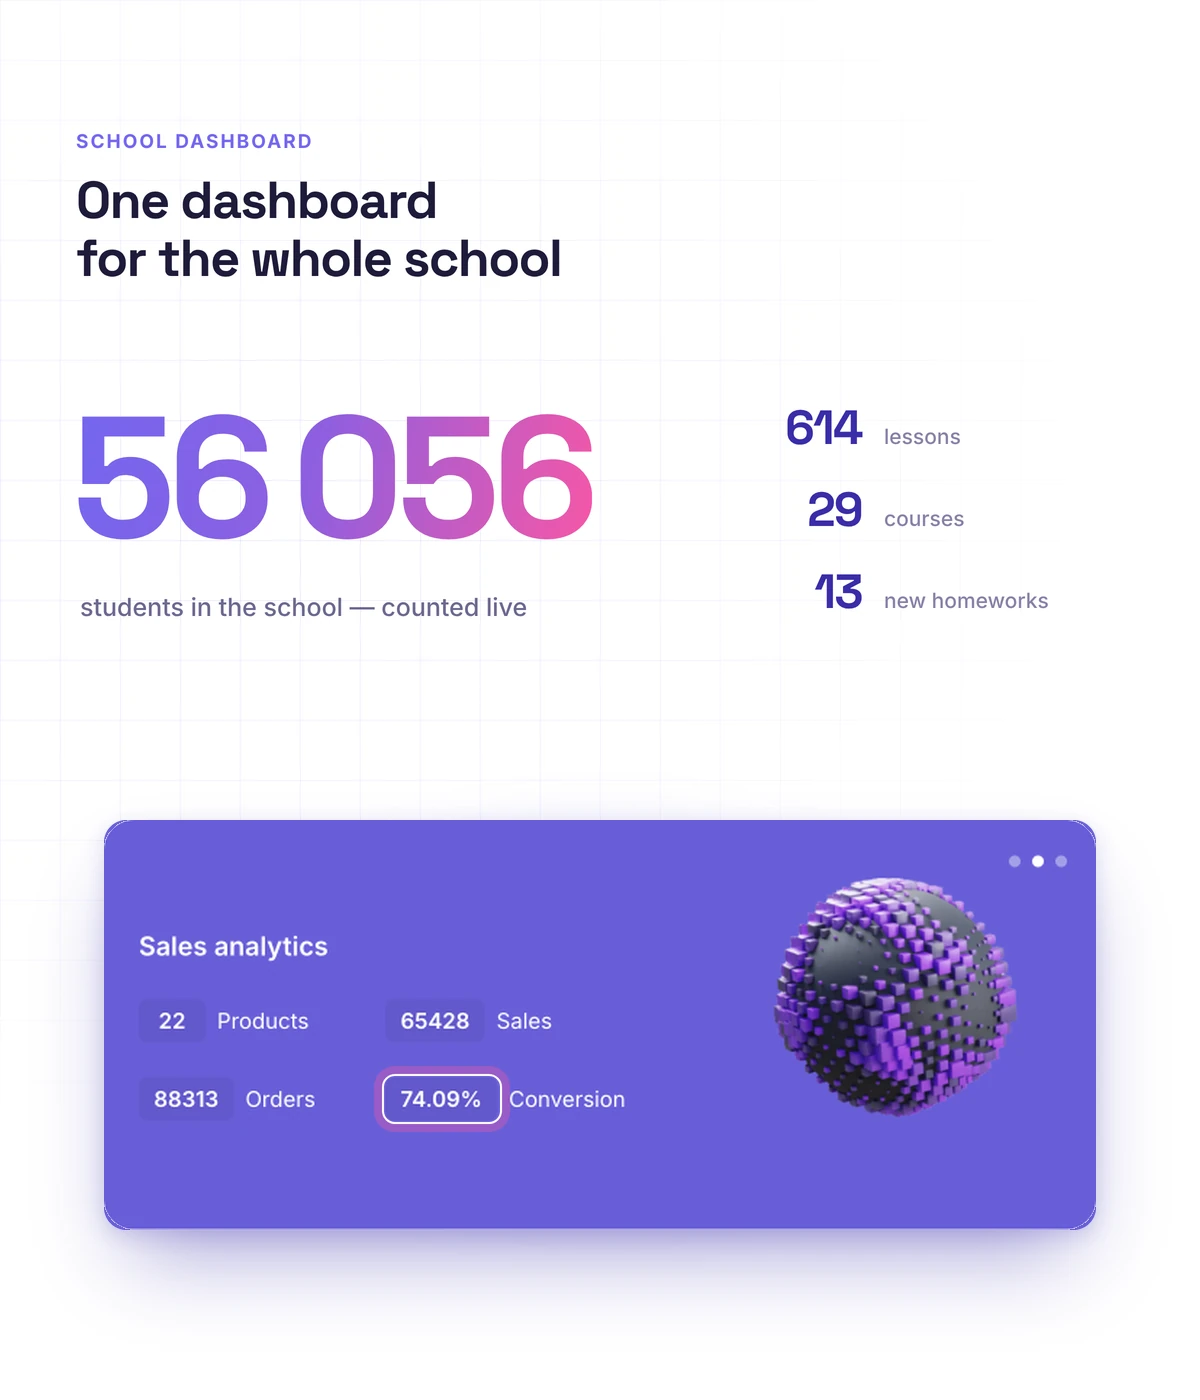
Learning
Learning analytics: progress and completion
You see how students move through courses: each person's progress, how many lessons are done, who finished and who is still going — by course, by lesson and by group, with a CSV export.
- Progress and completion by course and by lesson
- Statuses: in progress, finished, certificate received
- Student actions by course and group: started or finished a lesson, a test, an assignment
- Cohort retention: you can see whether the March cohort gets further than the January one
- CSV export by course, lesson and group
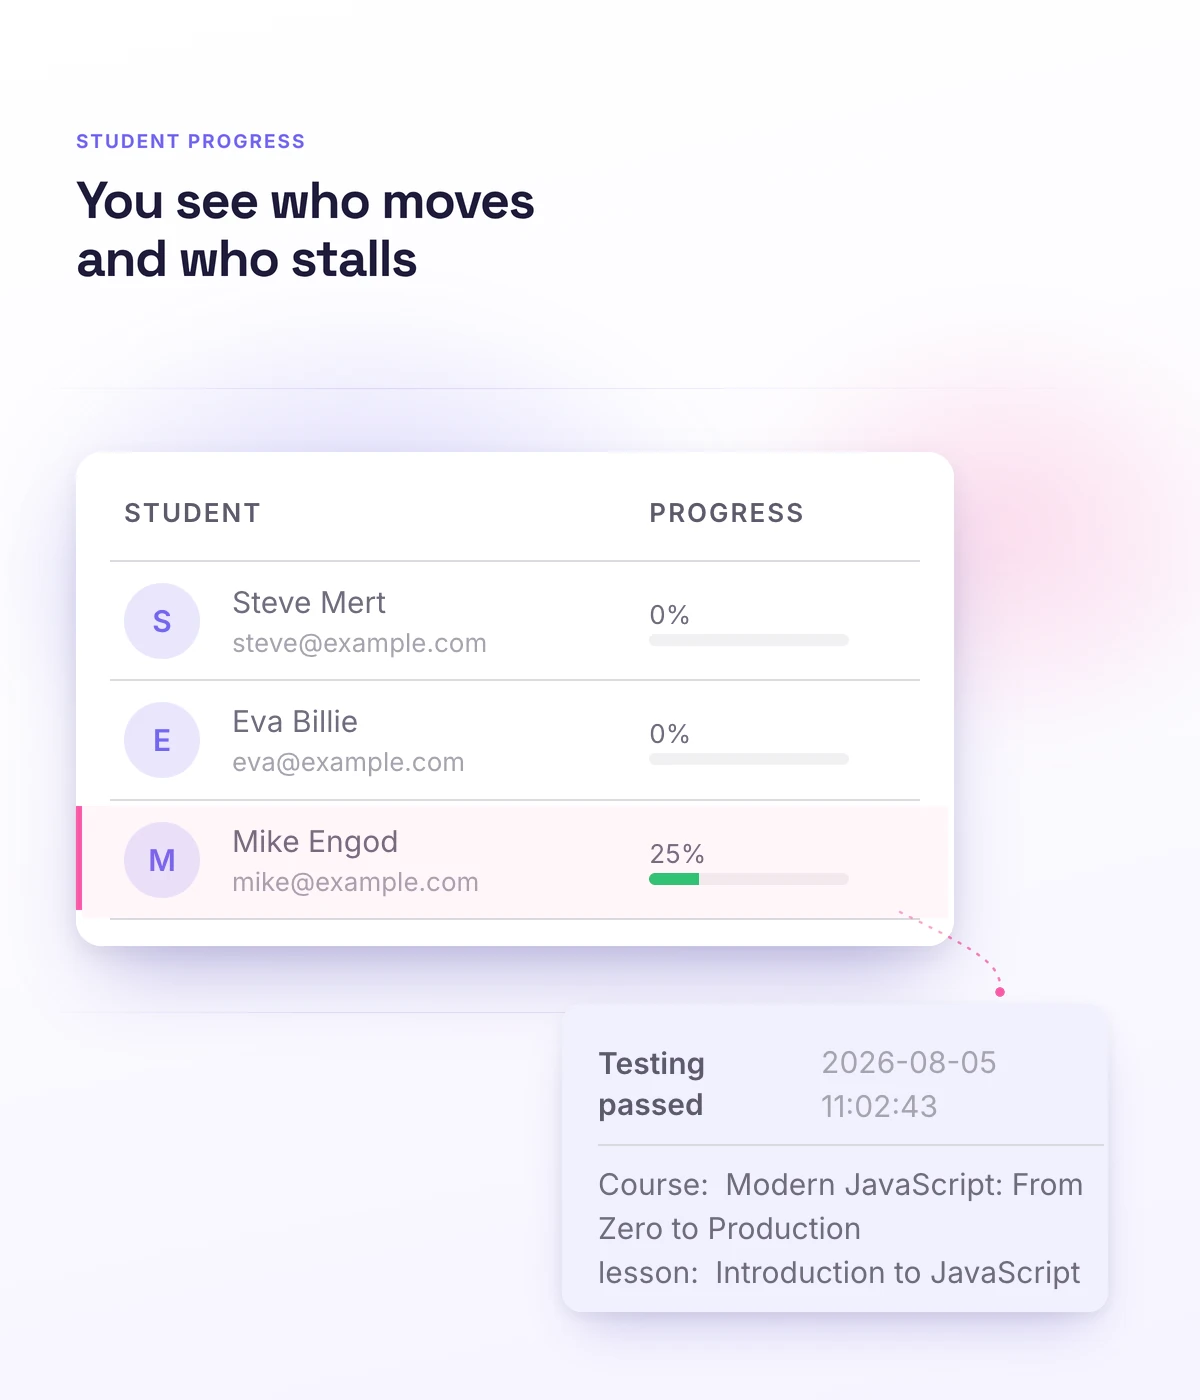
Sales
Sales analytics: you see what brings in money
Revenue, average order value and repeat purchases — by currency and by period. You can see which channel actually brings in money by UTM, and how customer value grows over time.
- Revenue trend, average order value and paid orders
- Top UTM sources by revenue
- LTV by cohort and the share of repeat purchases
- Discount performance and top products
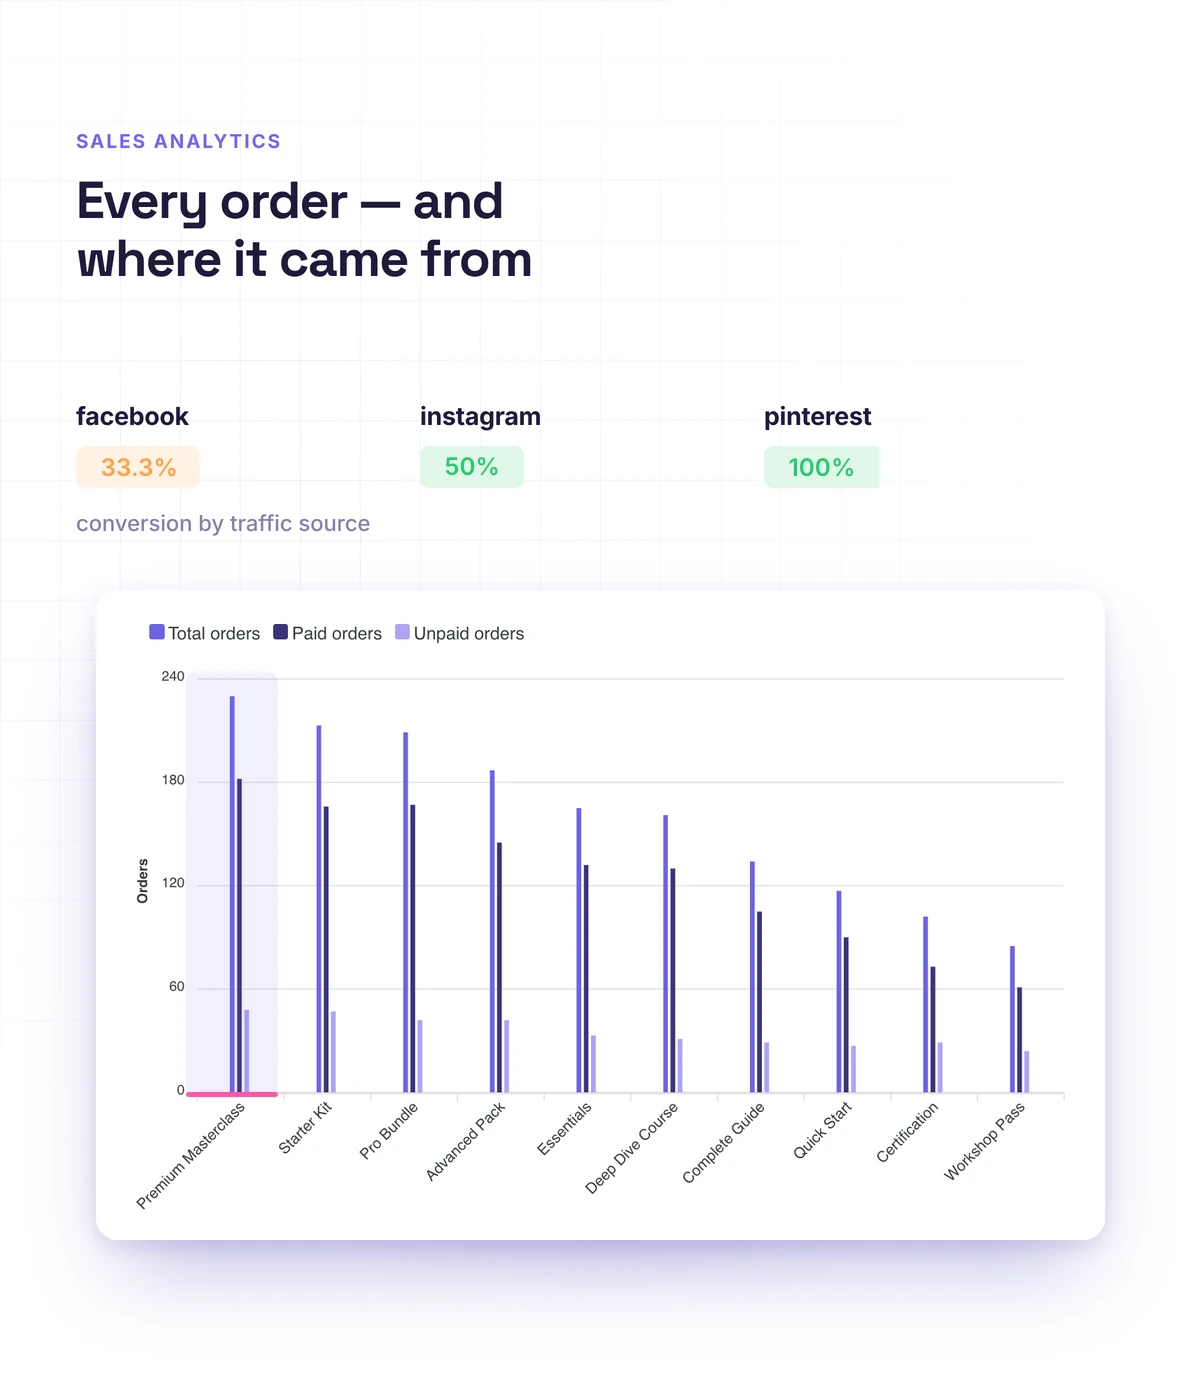
Engagement
Engagement: activity, points and participation
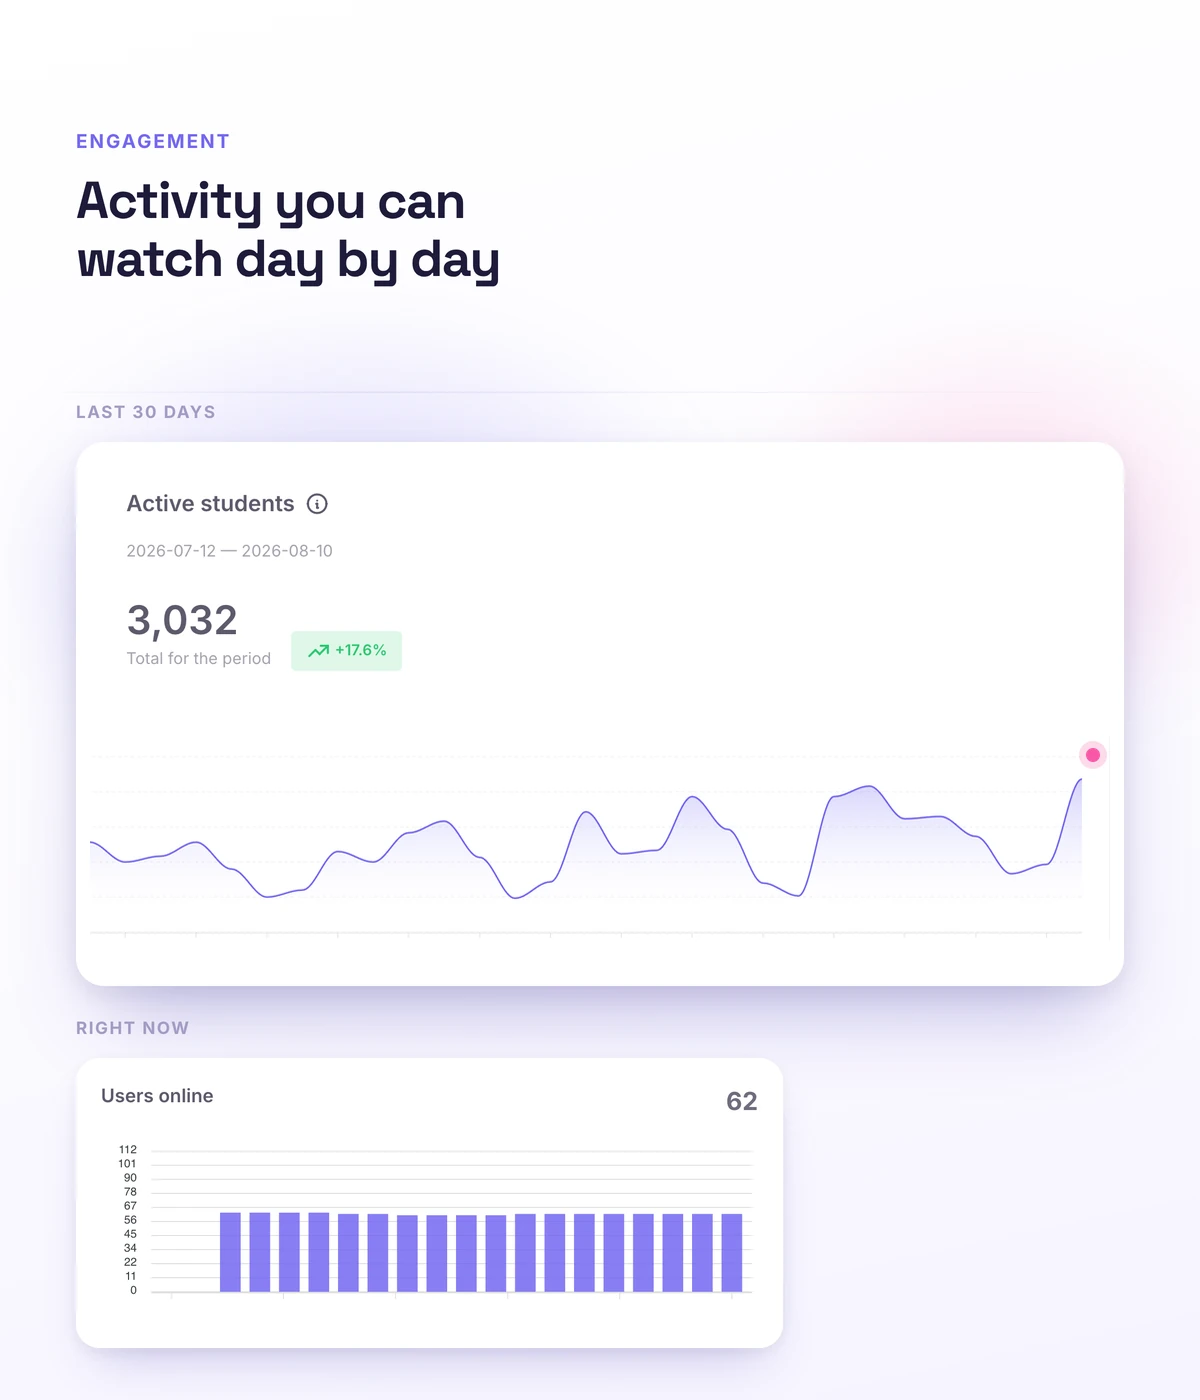
You see how engaged your students are: how they move through courses, how they collect points, and how they take part in the life of the school. It's an early signal, so you can step in before a student quits.
- Student activity for the period you choose
- Points and reward statistics from gamification
- Student actions by course and group
Dropout risk
You can see who is about to quit — before they do
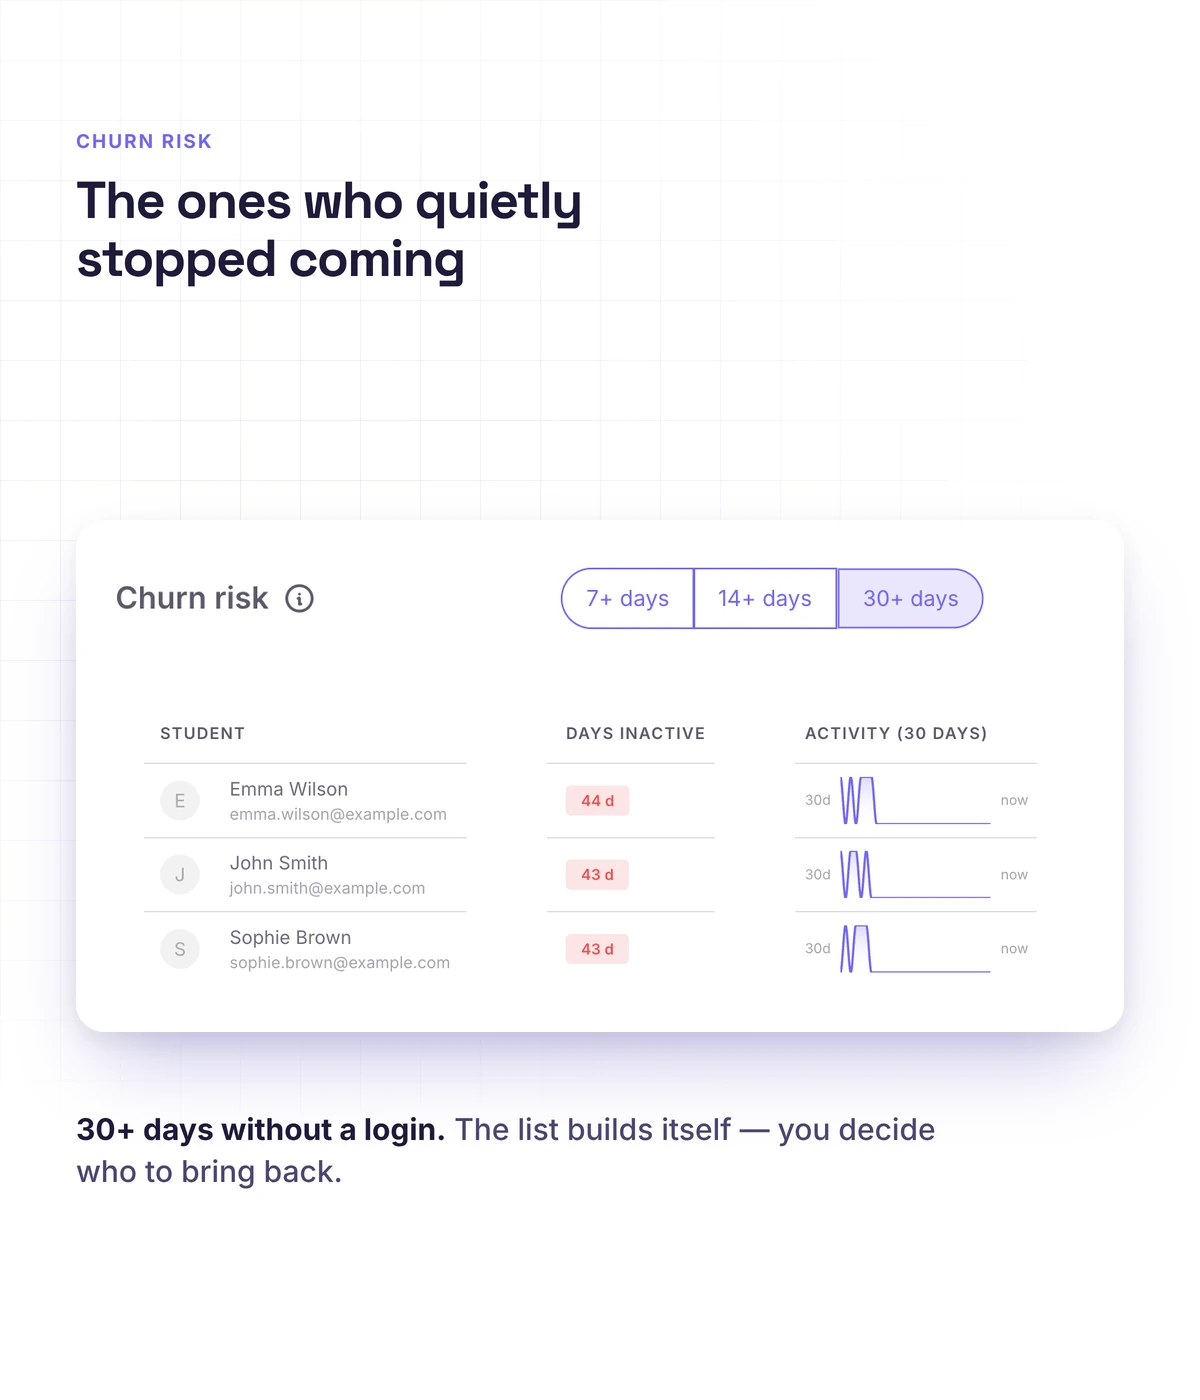
You bring a student back while bringing them back is still possible: the widget shows who hasn't logged in for 7+, 14+ and 30+ days, with an activity sparkline — so you can tell at a glance whether the person faded gradually or disappeared all at once.
- Who hasn't logged in for 7+, 14+, 30+ days
- Activity sparkline: a gradual fade or a sudden disappearance
- The list can be exported and used to run a win-back
Course funnel
You can see the exact lesson students fall off at
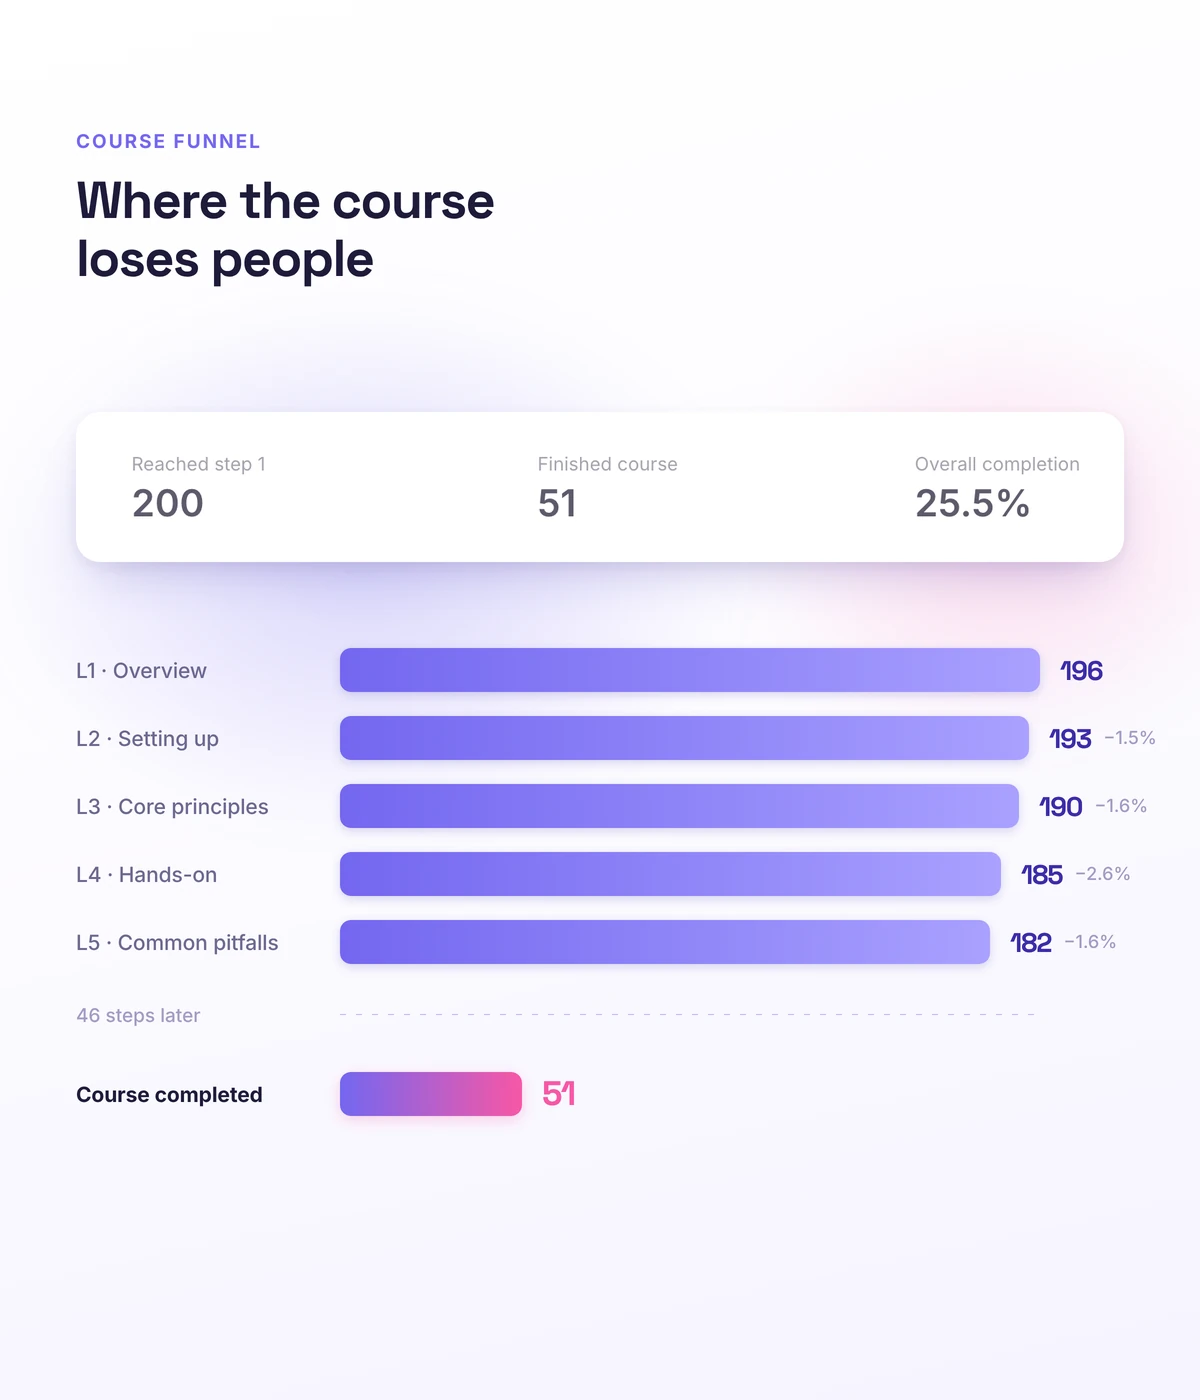
You fix the cause instead of the symptom: the course funnel shows drop-off for every lesson, and problem lessons rise to the top of the list on their own — if a third of the group falls off at lesson three, the lesson is the problem, not the students.
- Drop-off for every lesson — exactly where you lose people
- Problem lessons rise to the top of the list automatically
- Time to complete and the overall completion rate
Tests
You can see which question is badly worded
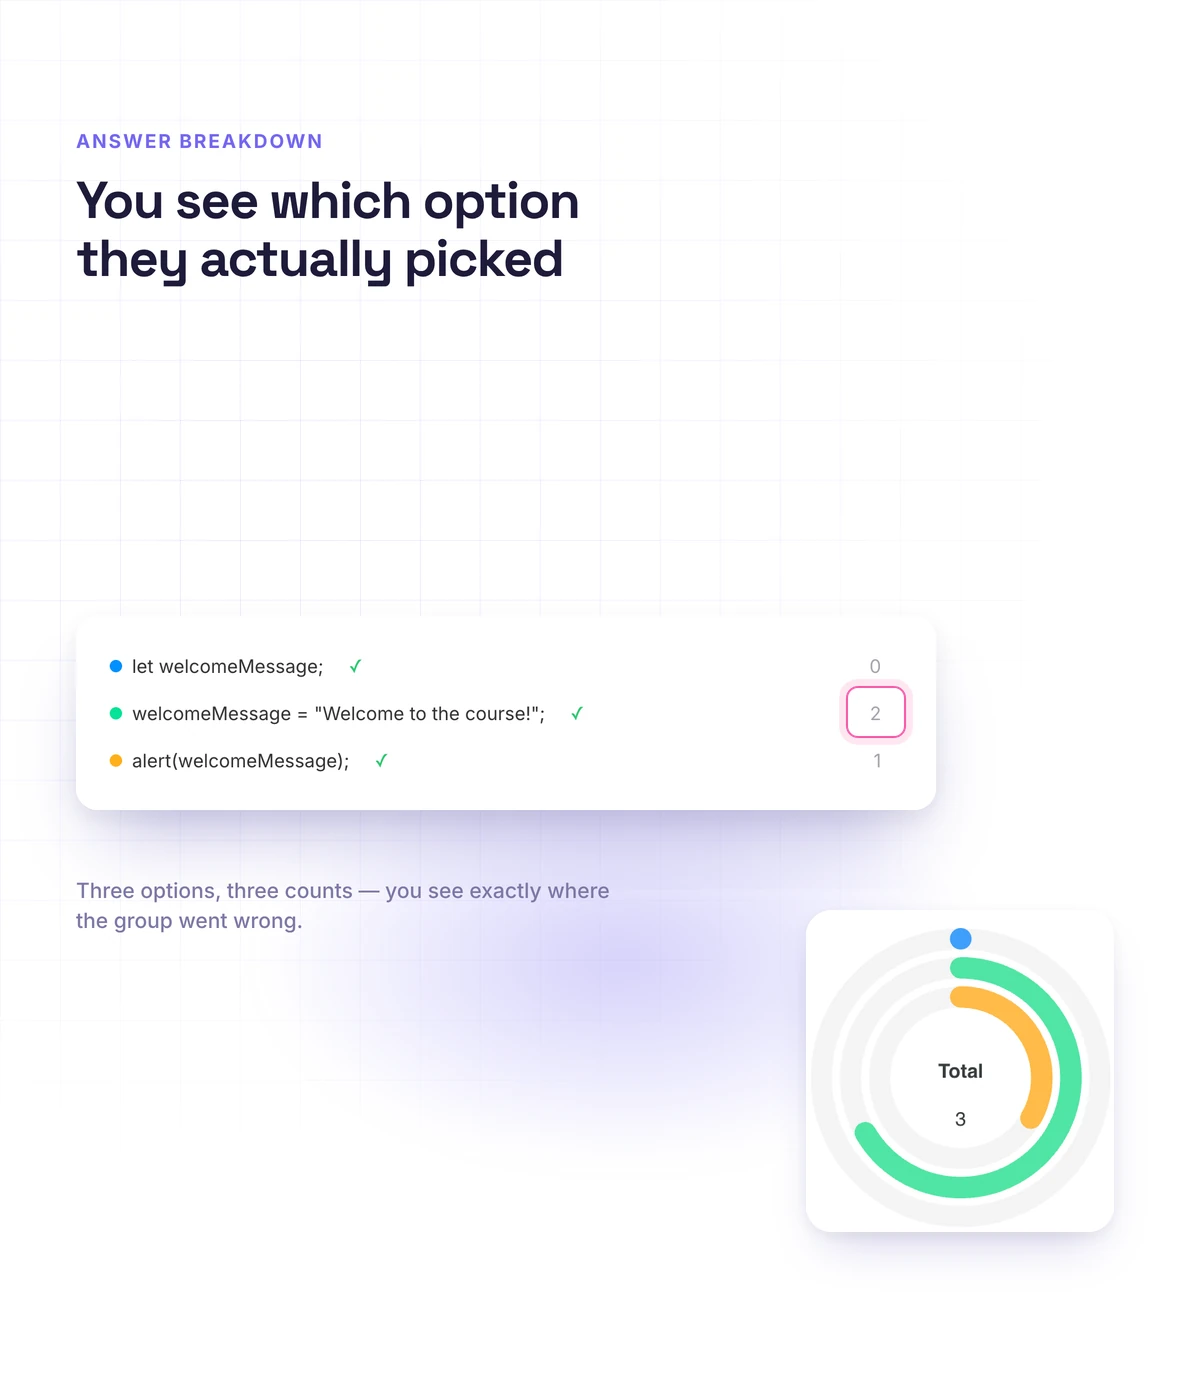
If most people picked the same wrong option, the students aren't the problem — the wording is: the statistics show the percentage of students for every answer option, and answers are exported question by question.
- Percentage of students for every answer option
- Export of answers for every question
Support
Student support — inside the platform
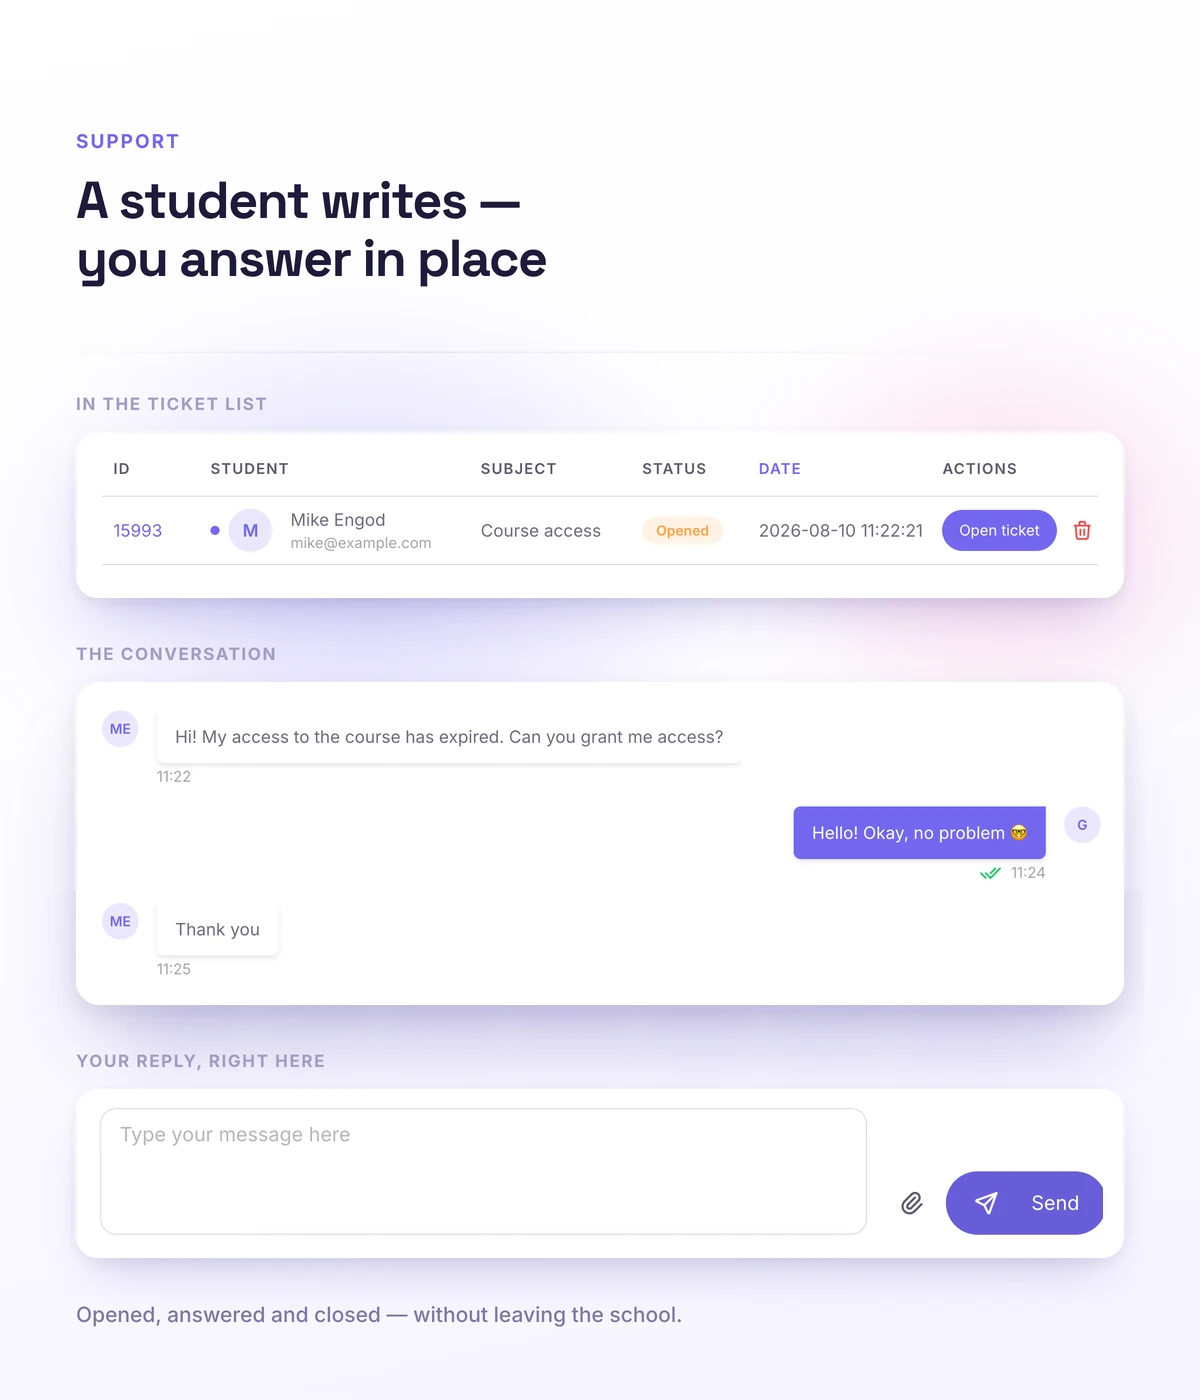
Support runs where the learning does: a student opens a request straight from their account, and the conversation stays in the platform — the question doesn't get lost in someone's DMs and doesn't reach you in a messenger at three in the morning.
- Tickets from the student's account, with attachments
- A conversation with replies to messages, reactions and pinning
- Statuses: new and closed
Team
A team with roles — everyone sees only their own part
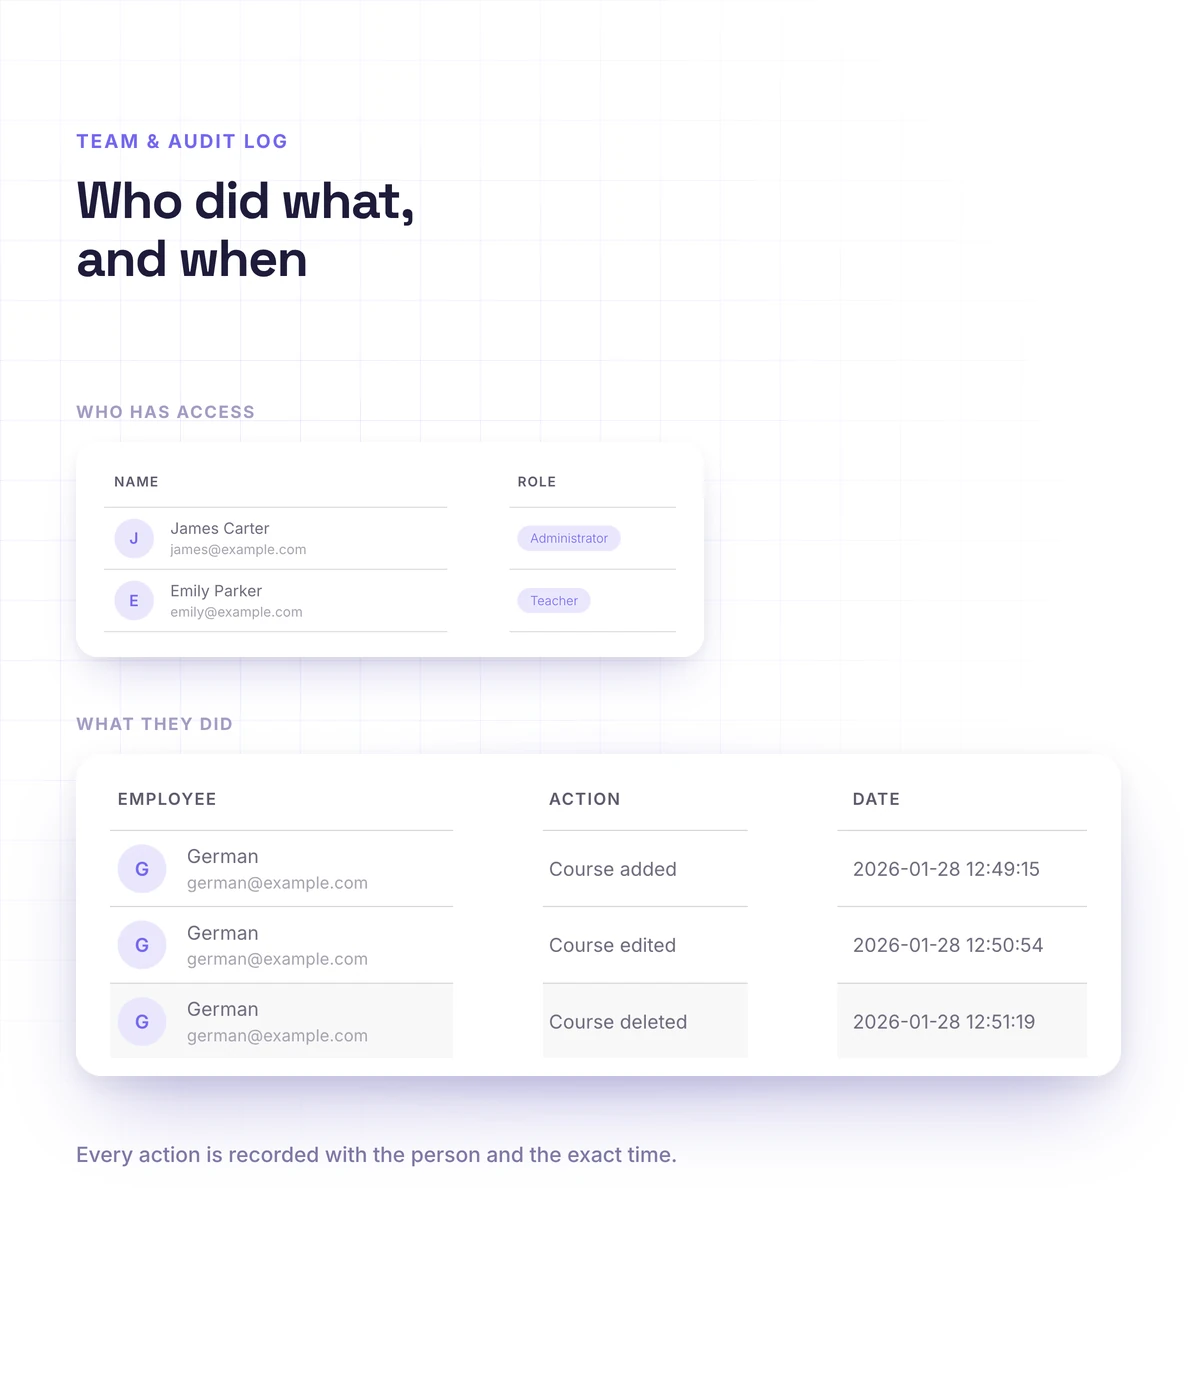
You add administrators and teachers and hand out permissions: the administrator runs the organization, the teacher runs the learning. You assign students and groups to a teacher, and the activity log shows who did what.
- Roles: owner, administrator, teacher — with permissions you configure
- Students and groups assigned to a teacher
- Team activity log: who, what and when — visible to the owner only
- Teacher statistics for a period: assignments accepted and rejected — a basis for calculating their fee
- Managing student access to courses
Real schools. Real results. Real people.
Founders and creators on what works best for them in Softbook.

"We picked Softbook because we needed one platform for selling courses and managing students. What we value most: video uploads, clear pricing with no surprises, and support that actually listens and acts."
Mike Pritula
Mike Pritula Academy

"The team moved all my lessons over by hand — I have no idea how I would have done it myself. They were careful about it. They keep improving the platform, they listen to what you ask for, and they genuinely look after every client."
Tanya Mykhalchenko
PPC advertising school

"Before we switched, we tried selling video lessons through Instagram, but without an admin it was impossible. Here I uploaded the courses, set up automatic payments — and the system runs itself. The courses bring in steady income without me being involved every day."
Olga Miller
Director, recruiting school

"We built a big knowledge base for our students on Softbook. No more 'live' sessions with speakers — everything is recorded and laid out in modules with tests and assignments. Our instructional designers can finally breathe."
Alexey Dinar
Personal coach

"Your platform solved a problem I had been struggling with for a long time. I uploaded a few courses, set up automatic payments — and stopped worrying about the technical side. I can see the courses selling and bringing in income every month."
Alla
Massage therapist

"Softbook let us scale our cleaning school into new regions with no extra spend on technology."
Yevhen Sukharev
Founder, Kyiv School of Cleaning

"In two years with Softbook we have built a full agency with an education arm. The platform covers everything we need."
Myroslav Liaskovets
Founder, LeadMarketing
Questions about analytics and management
No. Learning, sales, and engagement are on one student base, in one place. The data can be exported for outside analysis.
Yes. You see each student's progress, how many lessons are done, who finished and who is still going — by course, by lesson and by group, with a CSV export.
You add administrators and teachers, configure permissions for each of them, and then assign students and groups to a teacher.
Yes. The activity log shows who did what in the school, and when.
Revenue, average order value, LTV by cohort, repeat purchases and top sources by UTM. Sales operations are on the sales and CRM page → Sales and CRM
Yes. The "Dropout risk" widget shows who hasn't logged in for 7+, 14+ and 30+ days, with an activity sparkline — so you can tell whether the person faded gradually or disappeared all at once.
The course completion funnel shows drop-off for every lesson, and problem lessons rise to the top of the list automatically.
No. A student opens a request straight from their account: a ticket with attachments, a conversation with reactions and pinning, and "new" and "closed" statuses.
Grow the school without losing your grip on it
30 days free, no card. Analytics, student progress and team roles — on one platform.